OrgaMapper
ImageJ plugin for detecting and mapping organelles within cells
Shiny App Execution
The data analysis is realized as a Shiny app. This allows you to read in the output data and execute the data processing using a graphical interface.
Install r and r studio for running the Shiny app:
https://www.r-project.org/
https://rstudio.com/products/rstudio/download/
Then download the contents of the OrgaMapper_Shiny repository: OrgaMapper Shiny
Here is a link to the OrgaMapper Shiny repository: https://github.com/schmiedc/OrgaMapper_Rshiny
Shiny app execution
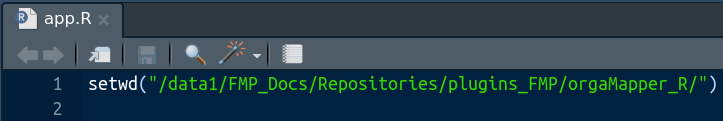
Open the app.R file in RStudio. Then specify the location of folder that contains the scripts in the setwd() line:
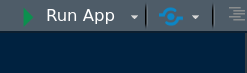
To open the Shiny app press Run App in the top left corner of the RStudio editor:
The OrgaMapper data analysis interface will appear:
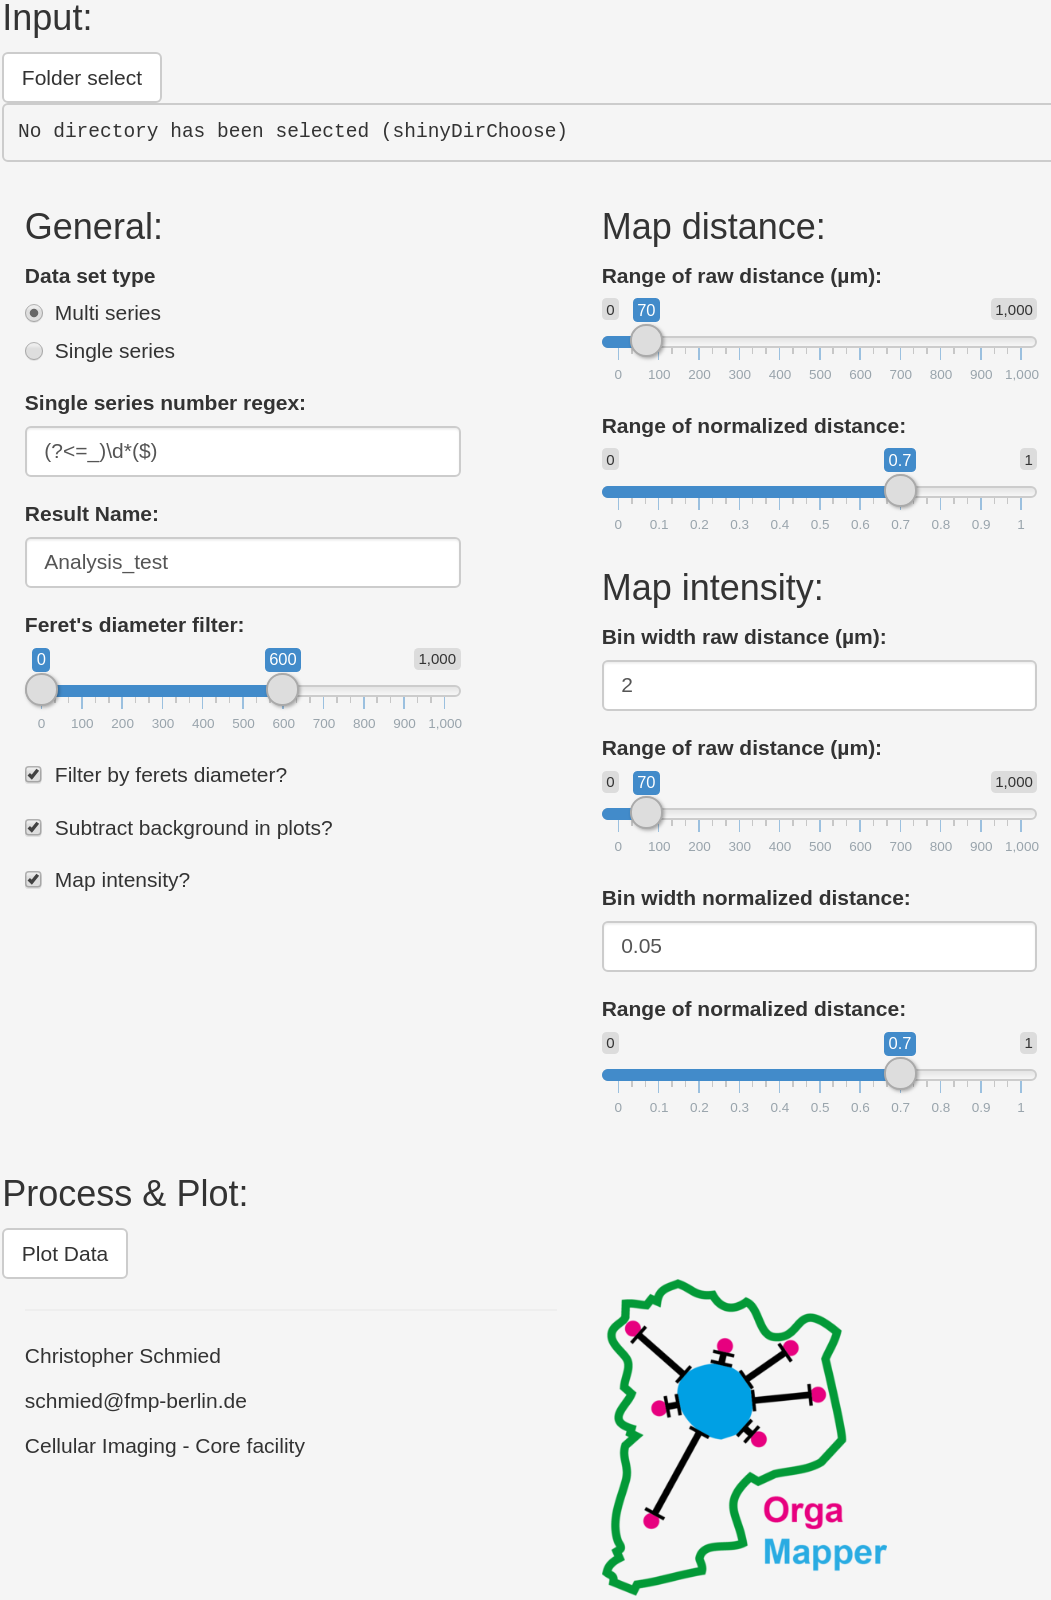
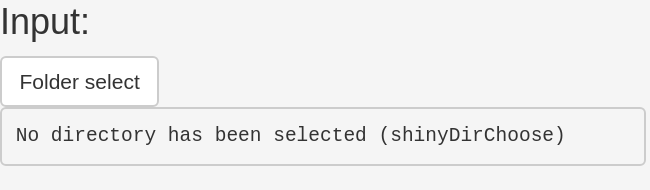
Specify the output folder of the Fiji plugin as input folder of the data analysis using Folder select.
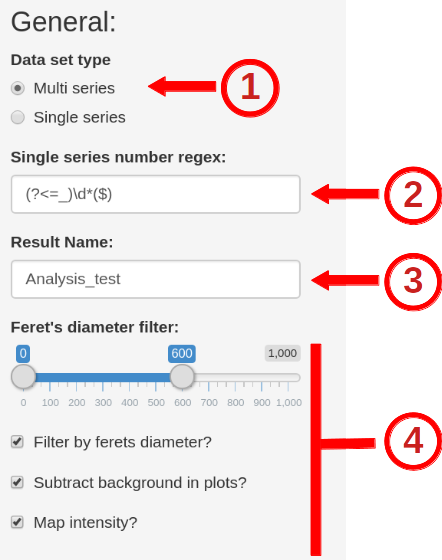
General settings:
Then specify which data set type your original image data was. If you processed multiseries .nd2 files or multiseries files of any different image data format then specify Multi series. If you processed single series file, like single series .tiff or other image formats then specify Single series (1).
To extract the series number properly you might need to adjust the regular expression setting for single series data under Single series number regex (2)
Then specify a name that the resulting .xlsx files should have (3).
Further you can specify an optional Feret’s diameter filter which you can also toggle on/off. You can also turn on and off the automatic background subtraction for the plots. Finally, computing the intensity maps is relatively time consuming, thus if you only require the distance maps you can turn it off here as well (4).
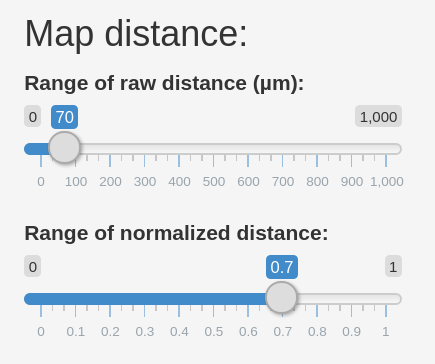
Map Distance
For the distance measurements you can specify the range of the raw as well as the normalized distance plot here:
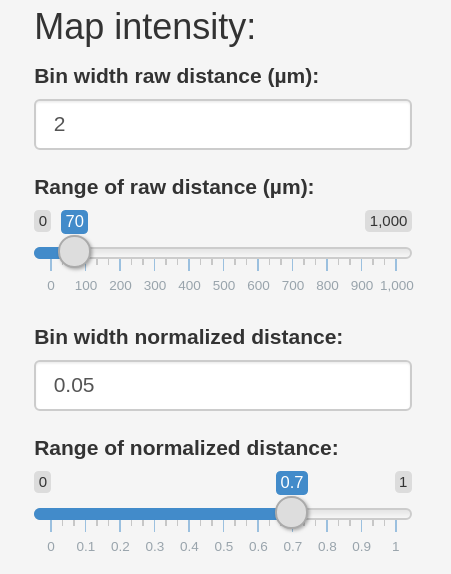
Map Intensity
For the intensity measurements you can specify the bin width, range of the raw as well as the normalized intensity plot:
Process & Plot
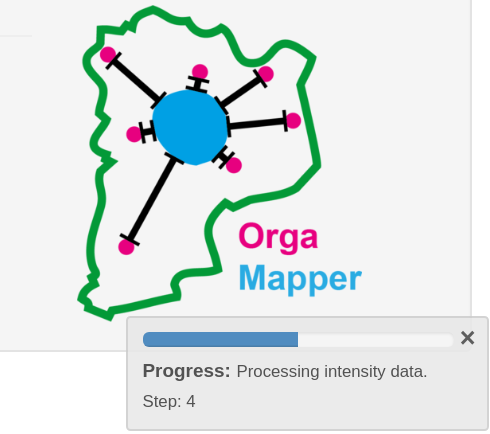
When done with the setup you can start the data processing and plotting by pressing Plot Data.
A progress bar in the lower right corner of the App will appear.