OrgaMapper
ImageJ plugin for detecting and mapping organelles within cells
Analysis Results
The resulting plots will be saved individually in the specified input directory under plot_distance_map and plot_intensity_map. The processed data will be saved as raw and summarized data in .xlsx files:
InputFolder
├── <imageName>
├── plot_distance_map
├── plot_intensity_map
├── <Date>-<Time>-settings.xml
├── <Result name>_cell.xlsx
├── <Result name>_detection.xlsx
├── <Result name>_intensityProfile_Membrane.xlsx (Optional)
├── <Result name>_intensityProfile_Nucleus.xlsx
├── <Result name>_intensityRatio_Nucleus.xlsx
├── cellMeasurements.csv
└── organelleDistance.csv
Result Files
-
<Result name>_cell.xlsx:
Contains the summarized distance data per cell. -
<Result name>_detection.xlsx:
Contains the collected distance data for each individual detection for each cell. -
<Result name>_intensityProfile_Membrane.xlsx (Optional):
Contains the collected average intensity profile measured from the membrane for each individual image. -
<Result name>_intensityProfile_Nucleus.xlsx:
Contains the collected average intensity profile measured from the nucleus for each individual image. -
<Result name>_intensityRatio_Nucleus.xlsx:
Contains the data for computing the intensity ratio (analysis optimized for distance from nucleus).
Overview Plots
Within the rShiny app you will then get overview plots under the tabs at the top for the different parameters.
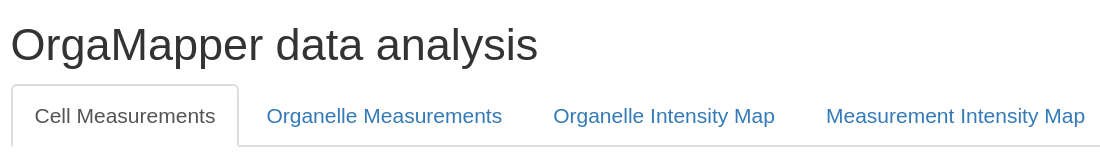
First, under Cell Measurements you will be informed:
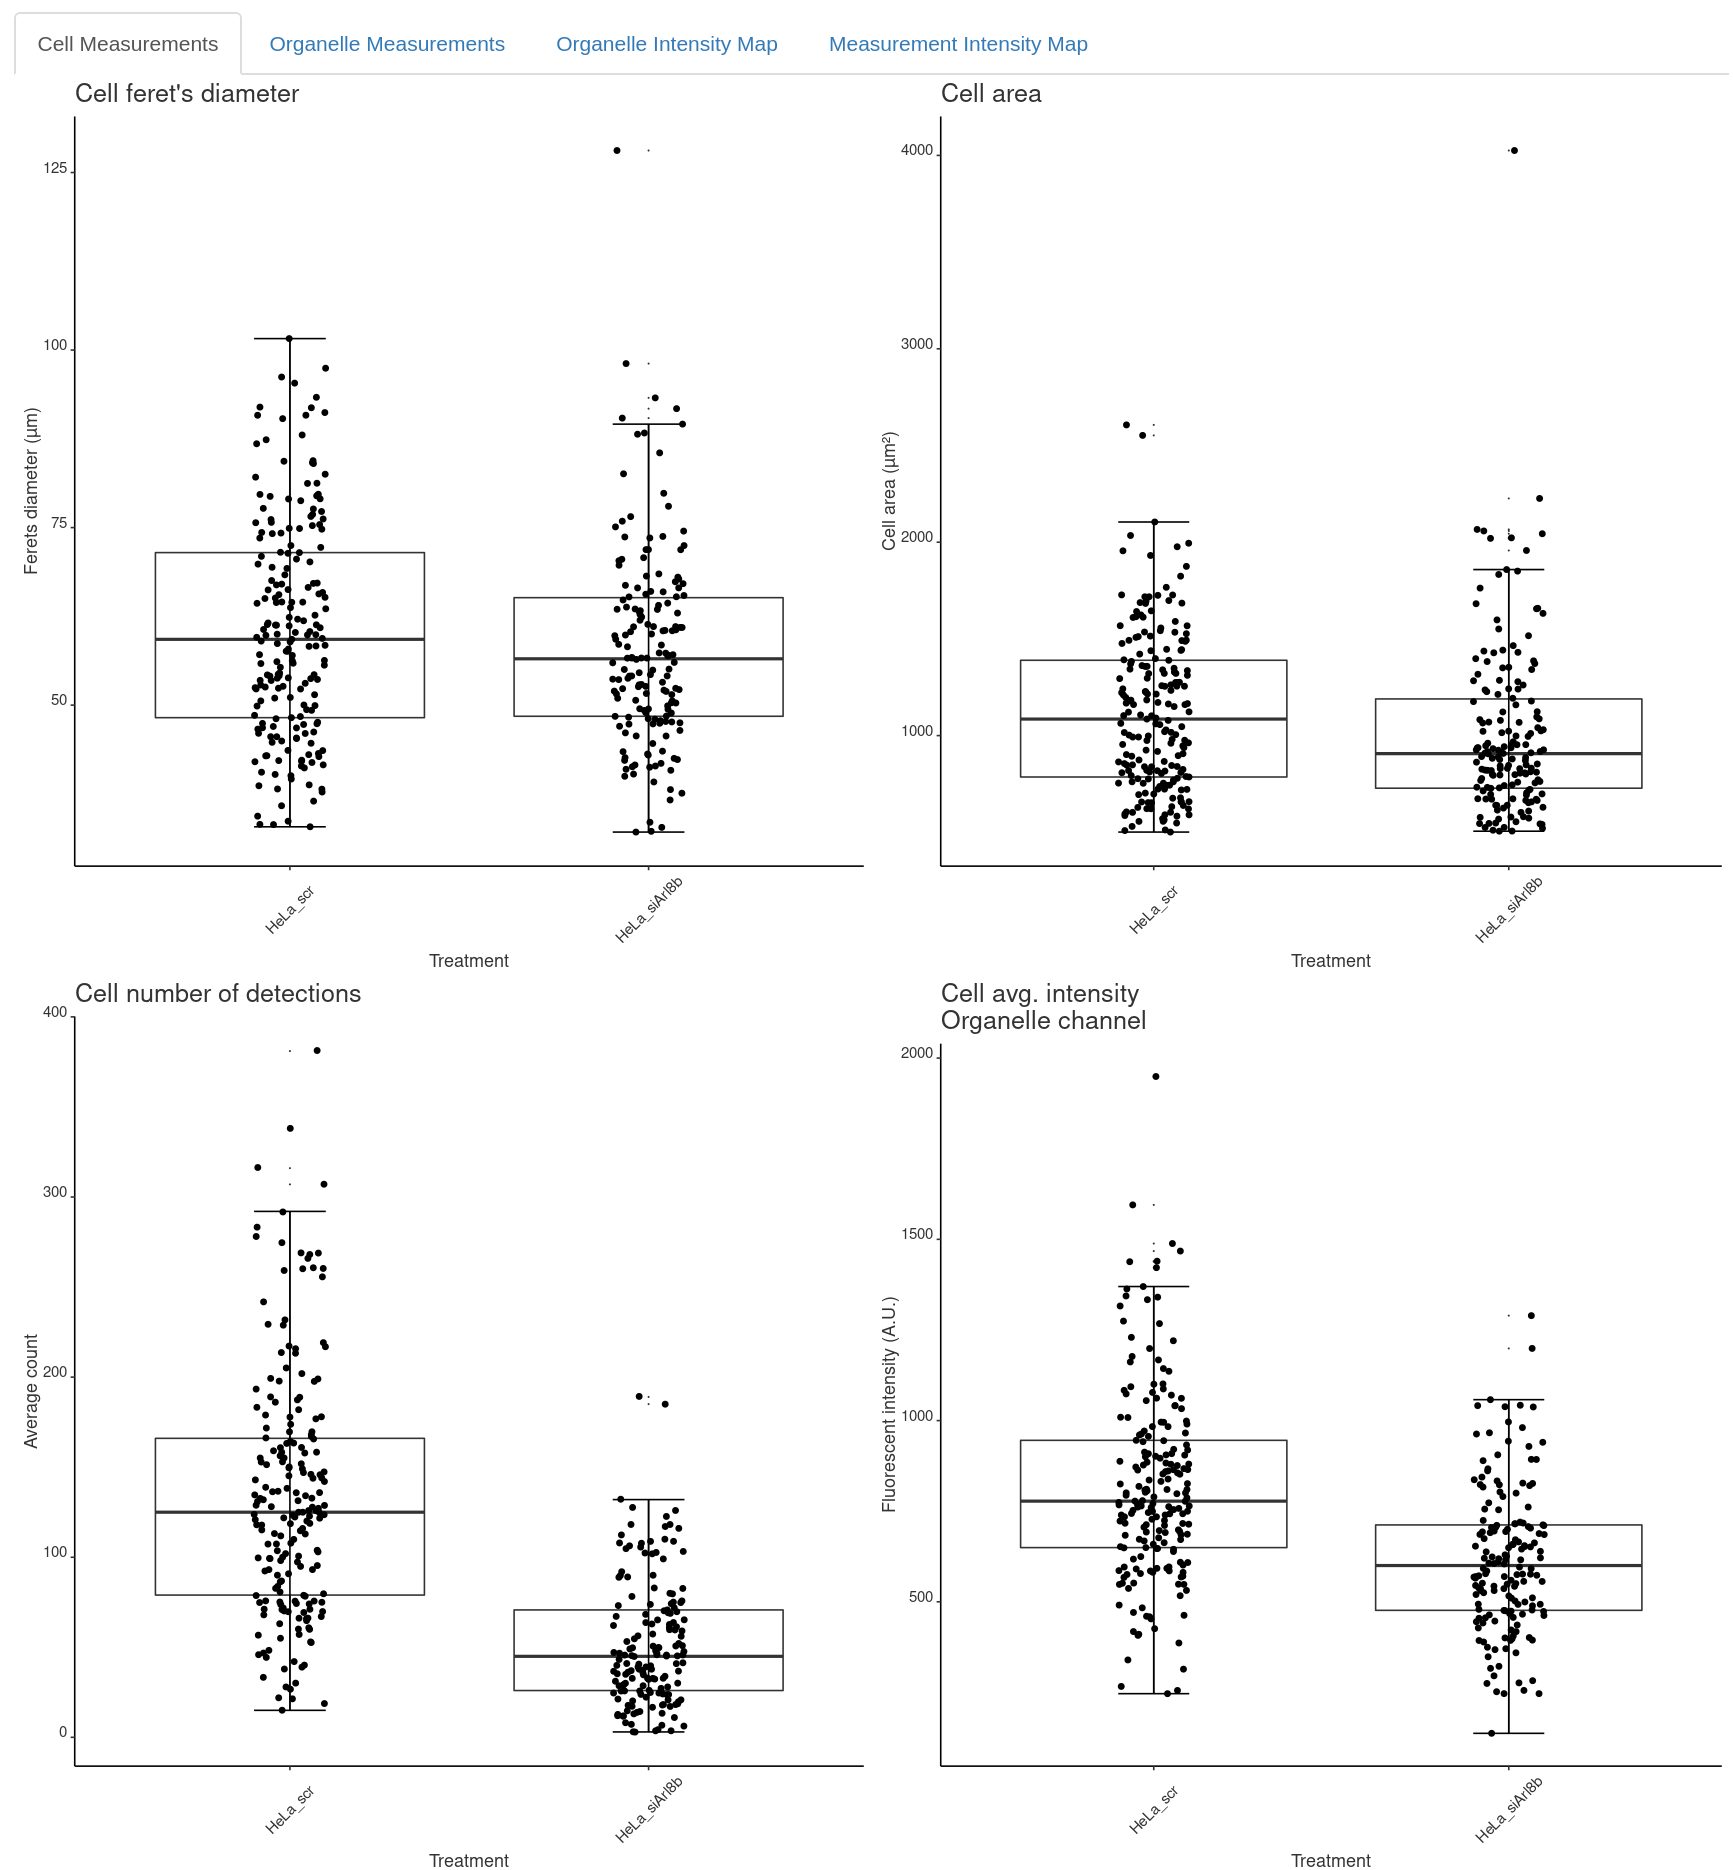
Second,you will find the organelle specific measurements under Organelle Measurements:
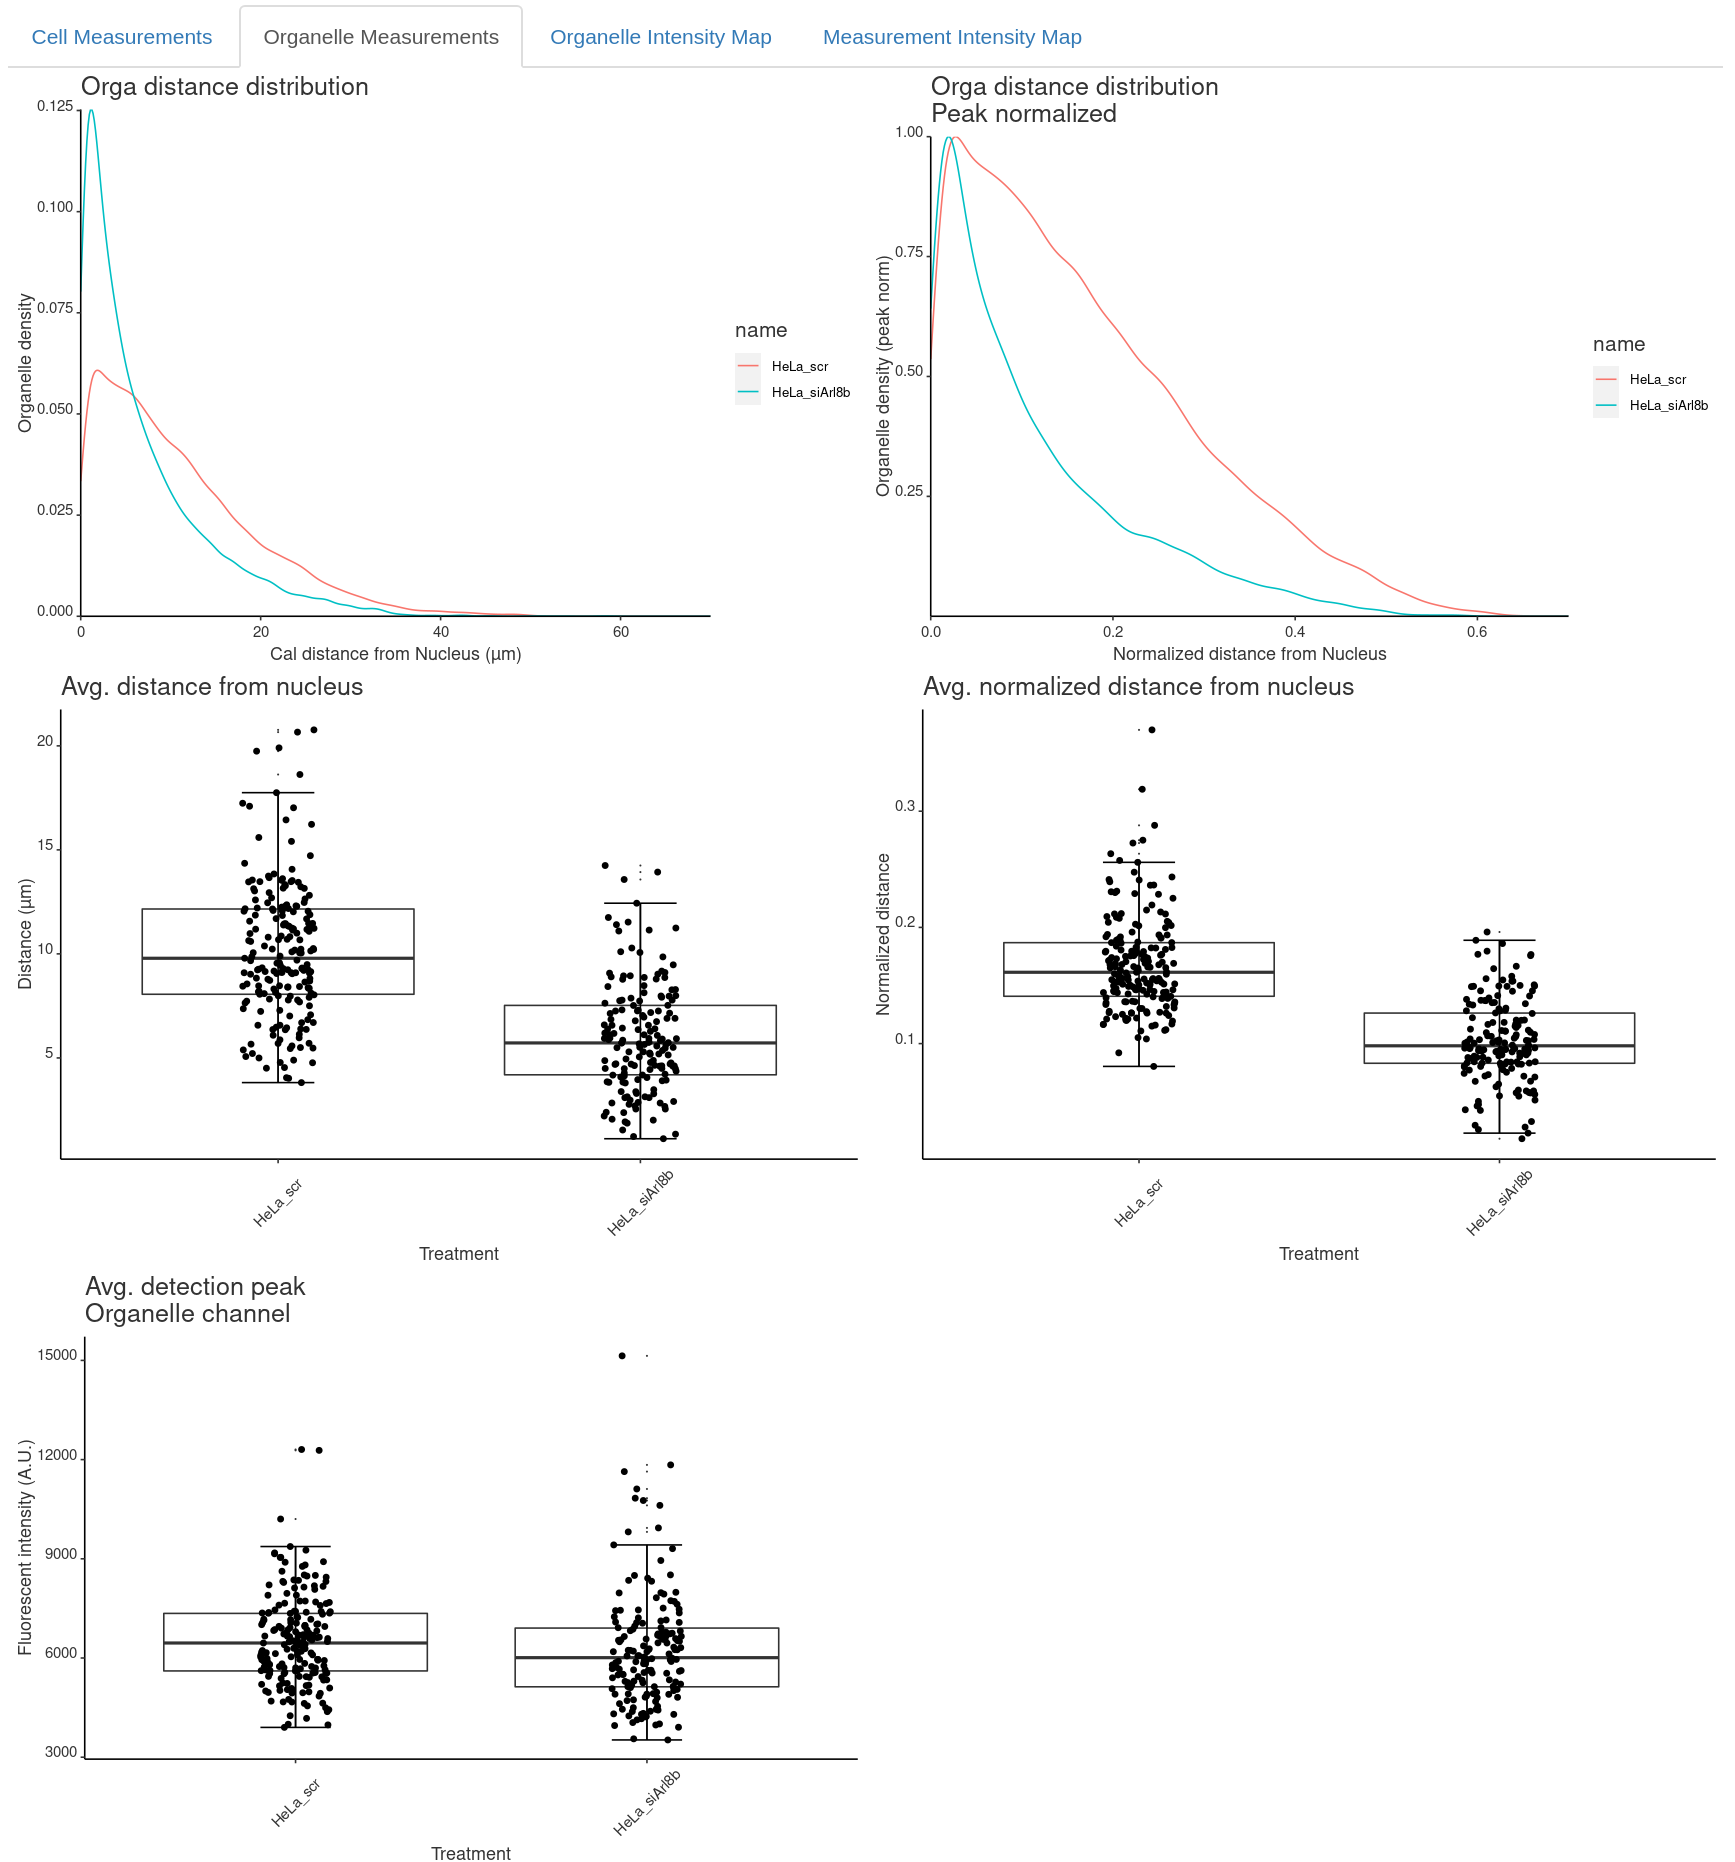
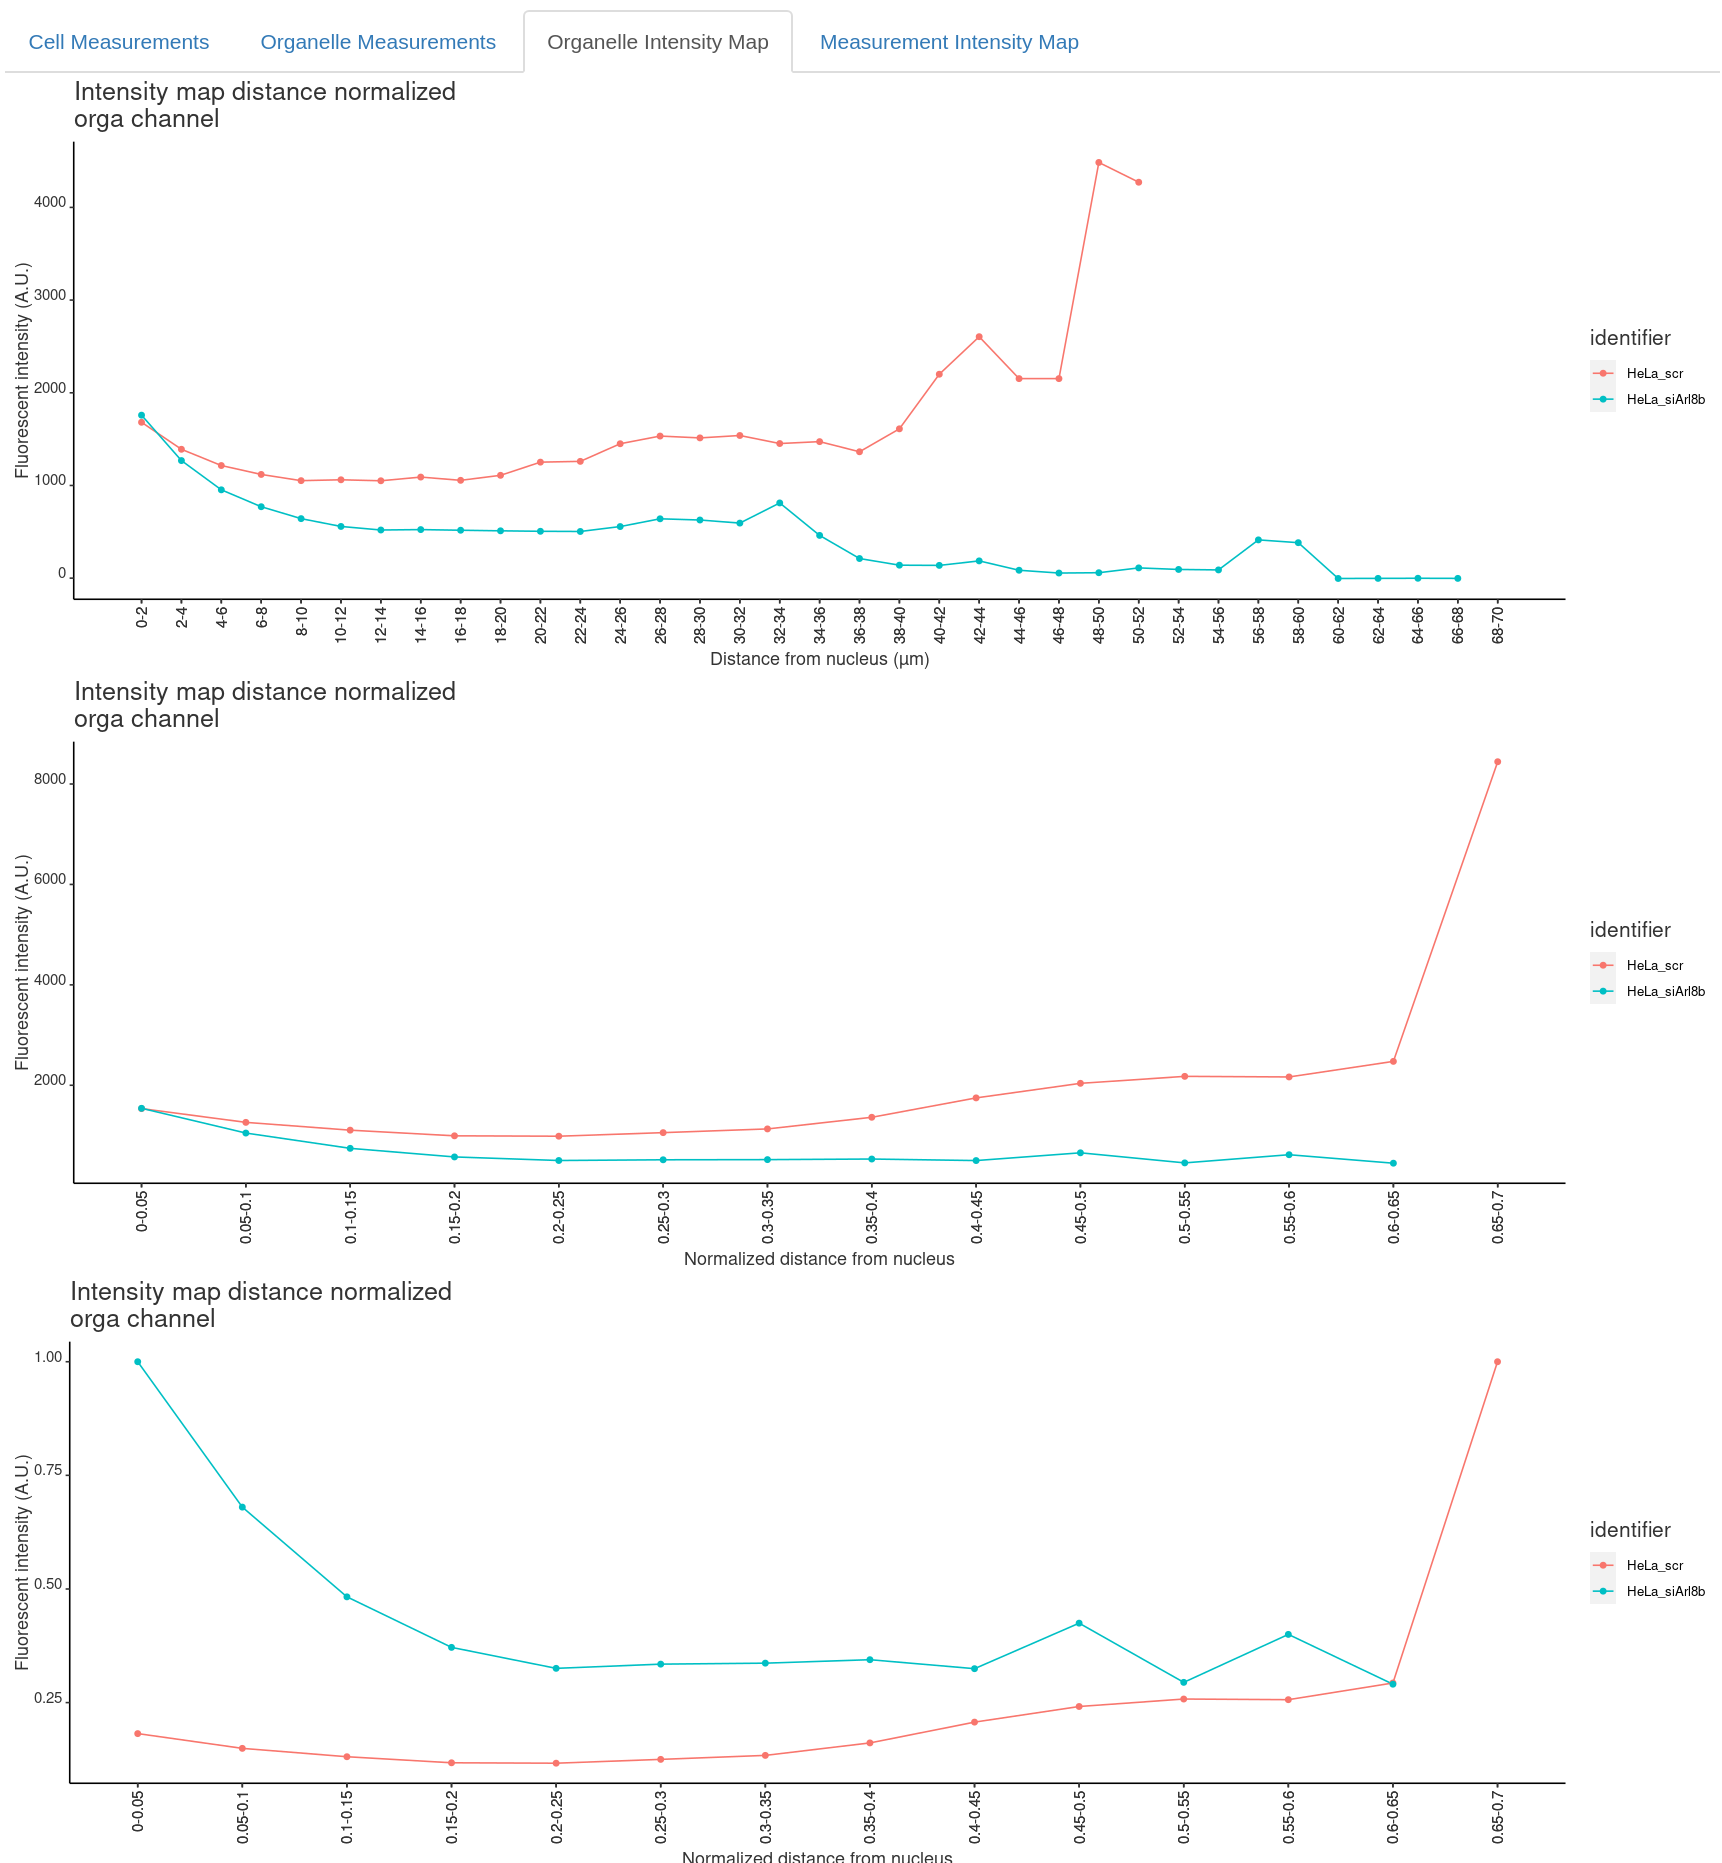
Finally, Organelle Intensity Map and optionally for another measurement channel you will find the intensity maps:
Measured parameters
Cell Measurements
In file <Result name>_cell.xlsx for each image, series and cell:
- ferets: Ferret’s diameter (calibrated units).
- cell_area: Cell area (calibrated units).
- orga_numberOfDetections: number of detections.
- orga_intensity: average signal in cytoplasm of organelle channel (Fluoresence A.U.).
- orga_background: average signal outside cell area in organelle channel (Fluoresence A.U.).
- x_nucleus_center_mass: x-coordinate center of mass of nucleus mask (pixels).
- y_nucleus_center_mass: y-coordinate center of mass of nucleus mask (pixels).
- (Optional) measure_intensity: average signal in cytoplasm of measurement channel (Fluoresence A.U.).
- (Optional) measure_background: average signal outside cell area in measurement channel (Fluoresence A.U.).
- orga_intensity_backsub: orga_intensity - orga_background (Fluoresence A.U.).
- (Optional) measure_intensity_backsub: measure_intensity - measure_background (Fluoresence A.U.).
- orga_meanDistance_nucleus_pixel: mean distance of organelles from nucleus (pixels).
- orga_meanDistance_nucleus_calibrated: mean distance of organelles from nucleus (calibrated units).
- measure_intensityOnDetection: signal at detection in organelle channel (Fluoresence A.U.).
- orga_intensityOnDetection_backsub: measure_intensityOnDetection - orga_background (Fluoresence A.U.).
- orga_meanDistance_nucleus_normalized: orga_meanDistance_nucleus_calibrated / ferets (calibrated units).
- (Optional) orga_meanDistance_membrane_pixel: mean distance of organelles from membrane (pixels).
- (Optional) orga_meanDistance_membrane_calibrated: mean distance of organelles from membrane (calibrated units).
- (Optional) orga_meanDistance_membrane_normalized: orga_meanDistance_membrane_calibrated / ferets (calibrated units).
Organelle measurements
In file <Result name>_detection.xlsx for each, image, series and cell additionally to merged in cell measurements you will find per detection:
- x_detection: x-coordinate of detection (pixels).
- y_detection: y-coordinate of detection (pixels).
- orga_distance_nucleus_pixel: distance of detection from nucleus (pixels).
- orga_distance_nucleus_calibrated: distance of detection from nucleus (calibrated units).
- orga_detection_peak: signal at detection in organelle channel (Fluoresence A.U.).
- (Optional) measure_detection_peak: signal at detection in measurement channel (Fluoresence A.U.).
- orga_detection_peak_backsub: orga_detection_peak - orga_background (Fluoresence A.U.).
- (Optional) measure_detection_peak_backsub: measure_detection_peak - measure_background (Fluoresence A.U.).
- orga_distance_nucleus_normalized: orga_distance_nucleus_calibrated / ferets (calibrated units).
- (Optional) orga_meanDistance_membrane_pixel: distance of detection from membrane (pixel).
- (Optional) orga_meanDistance_membrane_calibrated: distance of detection from membrane (calibrated units).
- (Optional) orga_meanDistance_membrane_normalized: orga_meanDistance_membrane_calibrated / ferets (calibrated units).
Intensity profiles
In file <Result name>_intensityProfile_Nucleus.xlsx the results are binned based on the binning settings specified in the rShiny App GUI. Optionally in file <Result name>_intensityProfile_Membrane.xlsx. For each image per bin:
- intensityDistanceCalibrated: distance of bin (calibrated units).
- orga_mean: average signal in organell channel in bin (Fluoresence A.U.).
- (Optional) measure_mean: average signal in measurement channel in bin (Fluoresence A.U.).
Notes
- Fluoresence A.U.: fluoresence signal arbitrary units
- (Optional): measurements selected by the user in the OrgaMapper plugin: Fiji Plugin Execution