OrgaMapper
ImageJ plugin for detecting and mapping organelles within cells
Fiji Plugin Execution
Example data
You can find example data here:https://doi.org/10.5281/zenodo.12773379
5_TestData
├── multi_series
└── single_series
Start and loading data
- Start Fiji
- Open OrgaMapper Fiji > Plugins > Cellular-Imaging > Map Organelle
- Setup dialog pops up
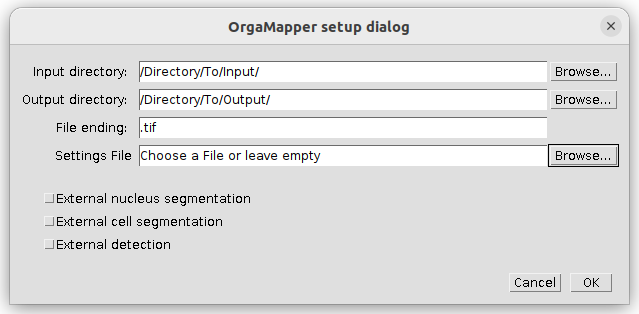
Specify the location of the input, output directories and the file ending of the files to be analyzed. If already available specify the location and name of a settings file or otherwise leave empty. You can specify files and directory also by drag & drop into the respective field.
Note: you can also load external segmentations and/or an external detection into the workflow please have a look at the External segmentation tutorial.
Press ok to continue.
OrgaMapper Preview
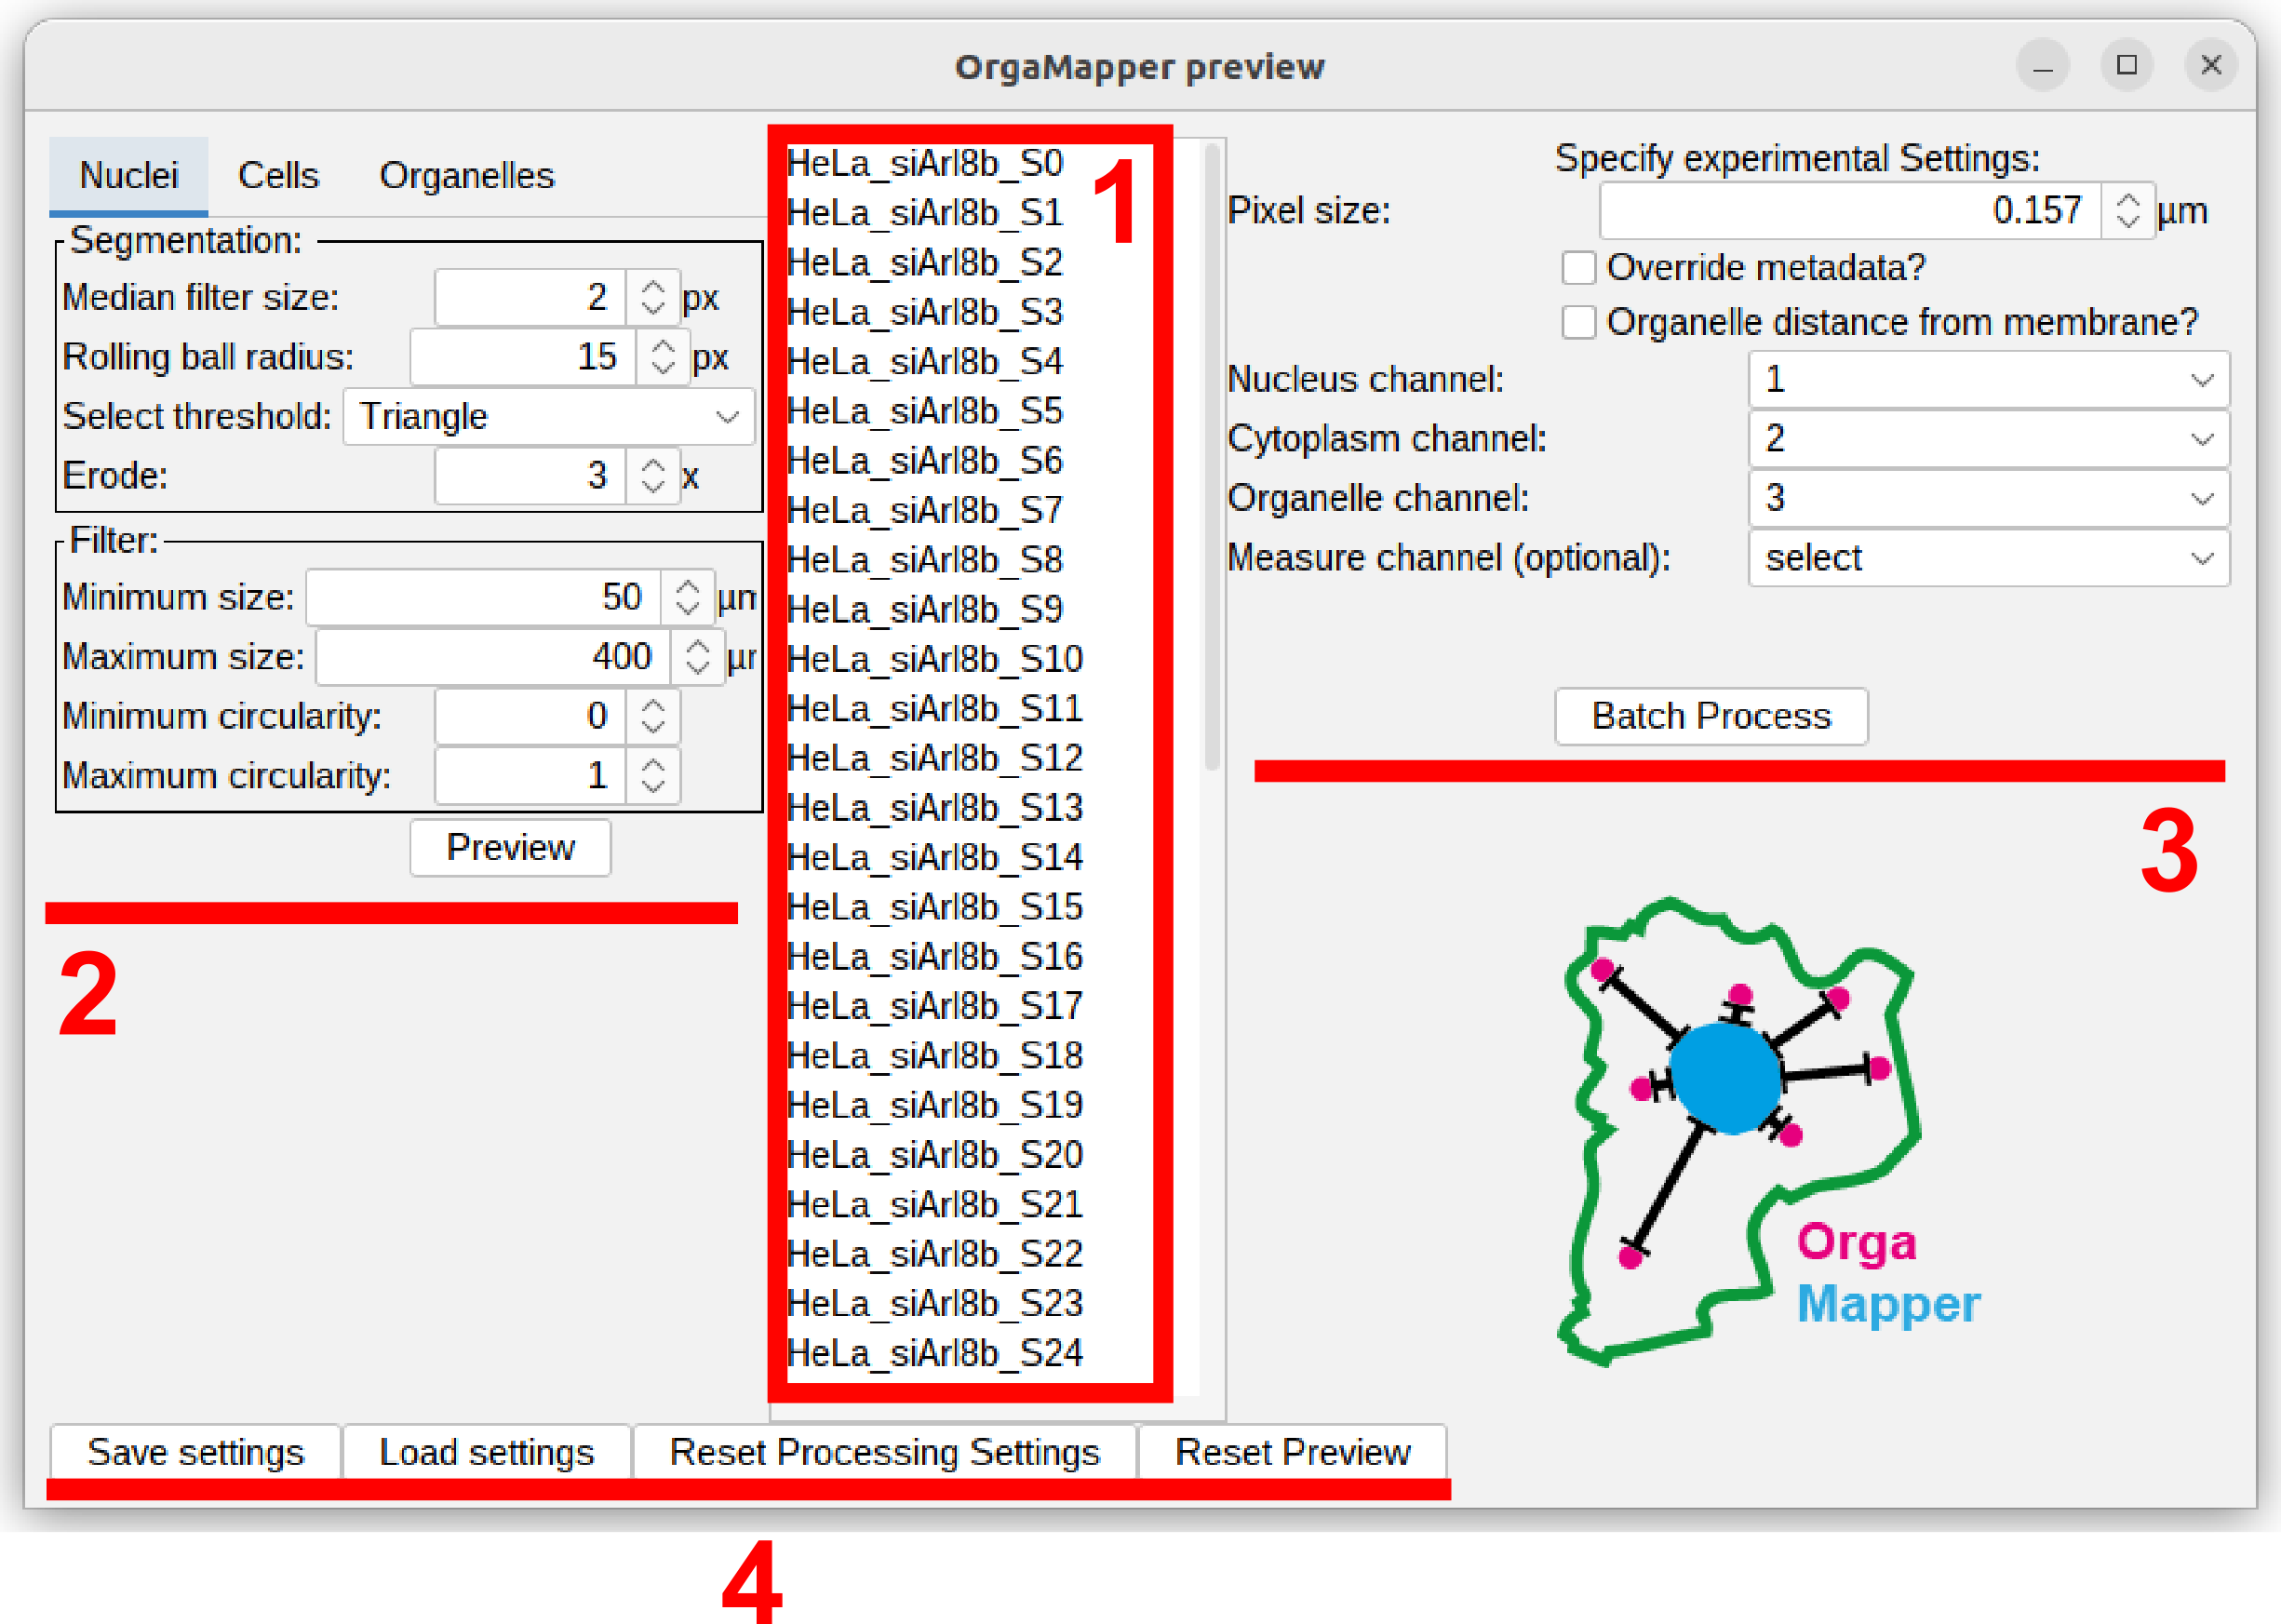
OrgaMapper will search recursively in the specified input directory for files with matching file ending. The OrgaMapper preview window will open. All the available input files will be displayed in the file list (1).
The left section of the preview menu contains tabs with the different processing settings for nuclei and cell segmentation as well as organelle detection. Upon first loading of the workflow without a settings file appropriate default parameters are loaded (2).
The right section contains all key experimental settings such as pixel size. Optionally the distance measurement can be also performed from the cell mask edge.Further the identity of each channel need to be specified here (3).
The lower bar contains menu items for saving, loading and resetting the processing settings as well as reseting the preview (4).
Save, load, reset settings and reset directories
The dataset settings as well as the segmentation and detection settings can be saved and loaded. The reset Reset Processing Settings button will restore the processing setting to the system default. You can also restart the preview using the Reset Preview button:

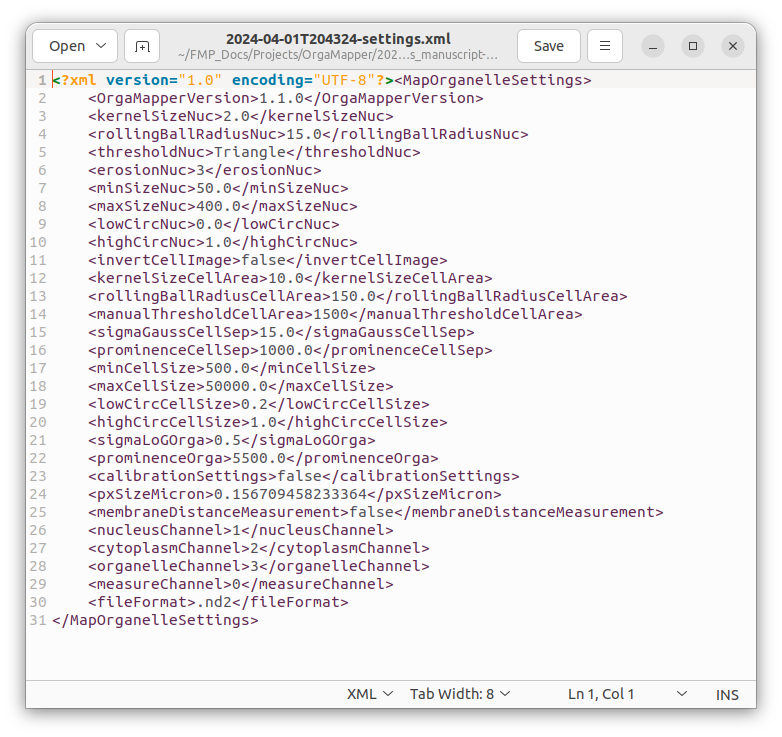
The workflow stores the experimental settings in a .xml file. This is a machine readable text file. You can open it with any text editor. The file is stored with the date and time when it has been saved: <Date>-<Time>-settings.xml. Each setting relevant for the processing is stored with the name of the specific setting.
Specify experimental settings
-
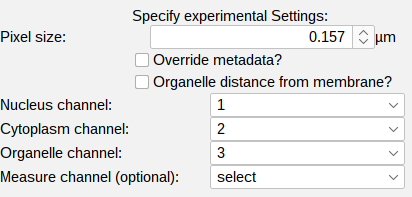
Pixel size: the pixel size of the loaded dataset is displayed. Verify if this is correct since segmentation parameters and the units of the measurements are depending on this setting. Modify this value and click the override metadata button if necessary.
-
Measure distance from membrane: the distance measurements (distnace of detections each pixel in the cytoplasm) can also be performed from the membrane by creating an euclidean distance map (EDM) from the cell mask edge.
-
Identity of the channels: each channel is associated with a specific segmentation or measurement task. Select the correct channels for each identity. The Measurement channel is an optional setting. You can leave this on select or ignore. If you want to extract intensity measurements from another channel specify any of the other channels.
- Nucleus channel
- Cytoplasm channel
- Organelle channel
- Measure channel (Optional)
Preview the segmentation parameters
Select a test image of the loaded image in the file list. If no file has been selected the program will prompt you to do so. In the tabs of the left section you can select the processing tasks you can optimize.
You can preview each segmentation setting on different images. In fact we want to encourage you to do so to find the optimal parameters for the entire dataset.
TIPP: the proposed segmentation is displayed as overlay over the image stack like any other Fiji image. So you can use any Fiji tools (zoom, pan, b/c) or can even duplicate or save the image as .tiff stack with the overlay!
In the following sections we will discuss the different processing options for each task.
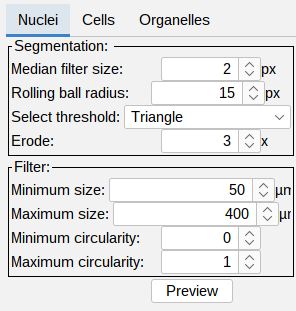
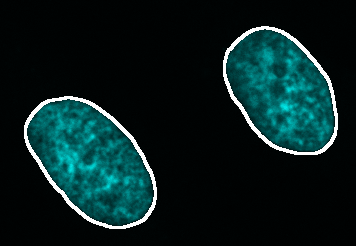
Nuclei segmentation
 |
 |
- Segmentation:
- Median filter size (px) - noise reduction using the median value of the neighboring pixels. The filter size determines the size of the neighborhood.
- Rolling ball radius (px) - radius of the rolling ball background subtraction.
- Select threshold - global intensity based thresholding algorithm.
- Erode (x times) - optional erosion applied to the masked generated by the thresholding.
-
Filter: you can filter the segmented nuclei using minimum and maximum size in square µm. As well as minimum and maximum circularity. This is based on Fijis Particle analyzer tool.
- Press Preview to see the outline of the segmentation on top of the nucleus channel. Adjust the brightness contrast of the image using: Image > Adjust > Brightness/Contrast…-** - **_Ctrl + Shift + C
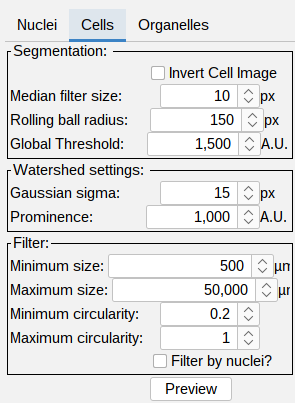
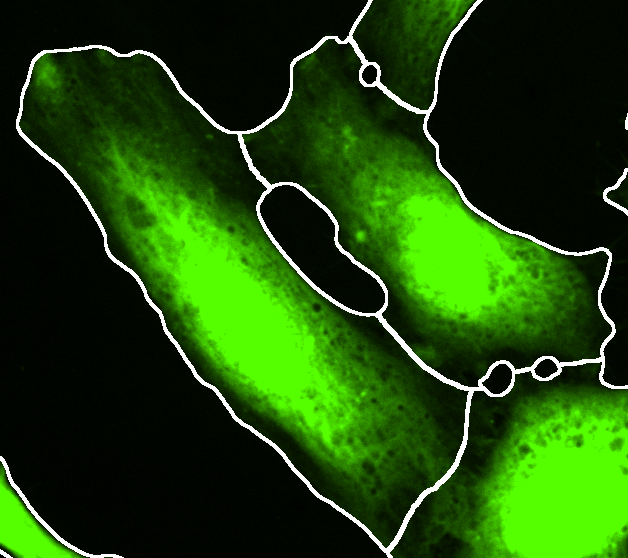
Cell segmentation
 |
 |
- Segmentation:
- Invert Cell Image - for a membrane staining the image can be inverted to achieve a segmentation. Tutorial: Segmentation of membrane signal.
- Median filter size (px) - noise reduction using the median value of the neighboring pixels. The filter size determines the size of the neighborhood.
- Rolling ball radius (px) - radius of the rolling ball background subtraction.
- Global Threshold (A.U.) - global intensity based threshold.
- Watershed settings:
- Gaussian sigma (px) - a large gaussian filter is applied to smooth out irregularities in the image and detect single cells.
- Prominence (A.U.) - detection of single cells to split touching cells.
-
Filter: tick this box to toggle the visualization cell segmentations with a single nucleus. This only affects the visualization. In the final processing the cells will always be filtered for cells that have a single nucleus. Cells without or with multiple nuclei present in the cell segmentation will always be filtered!
- Press Preview to see the outline of the segmentation on top of the cytoplasm channel. Adjust the brightness contrast of the image using: Image > Adjust > Brightness/Contrast… - Ctrl + Shift + C
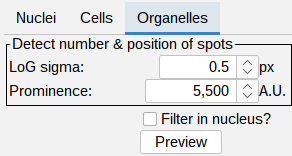
Organelle detection
 |
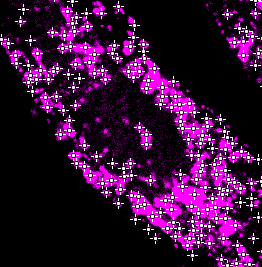 |
- Detect number & position of spots:
- LoG sigma (px) - a laplacian of gaussian filter is applied to enhance blob like structures.
- Prominence (A.U.) - detection of peaks in the filtered image.
-
Filter in nucleus: tick this box to toggle the visualization of detections in the nucleus area. This only affects the visualization. In the final processing the detections in the nucleus segmentation are always filtered.
- Press Preview to see the outline of the segmentation on top of the organelle channel. Adjust the brightness contrast of the image using: Image > Adjust > Brightness/Contrast… - Ctrl + Shift + C
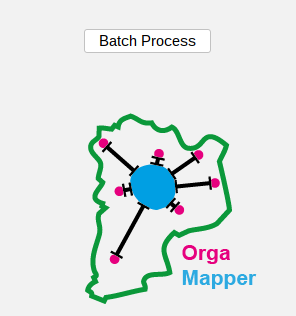
Batch processing
Once you are happy with the segmentation parameters press Batch Process. The result of the workflow will be saved in the specified output directory along the used settings.
The progress of the processing will be written in the Log file. Once finished the Log file will display:
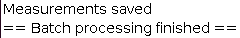
Results
For a documentation of the image analysis results have a look at the Fiji Plugin Results.
The results can be processed using an RShiny workflow: Shiny App Execution.