OrgaMapper
ImageJ plugin for detecting and mapping organelles within cells
Results of Fiji plugin
This is a documentation of the image analysis results. To understand how to process these results have a look at the Shiny App Execution.
Result images
The results of the workflow are structured the following way:
OutputFolder
├── <Date>-<Time>-settings.xml
├── cellMeasurements.csv
├── organelleDistance.csv
├── organelleDistanceFromMembrane.csv (Optional)
└── <imageName>
├── cellSegmentation.png
├── detections.tiff
├── intDistance.csv
├── intensityDistanceFromMembrane.csv (Optional)
└── nucSegmentation.png
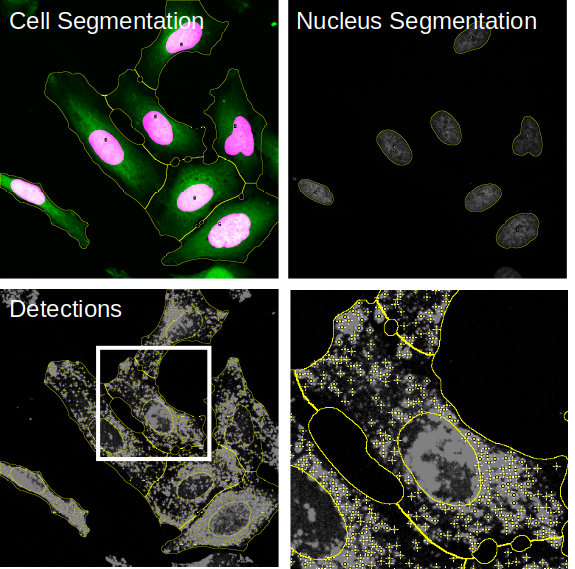
For each image a folder will be created containing visualizations for the segmentation task:
- cellSegmentation.png: file contains the cytoplasm channel overlaid with the nuclei segmentation and an outline of the cell segmentation.
- detections.tiff: file contains the organelle channel with overlays from the nuclei and cell segmentation as well as the organelle detection.
- nucSegmtnation.png: contains the nucleus channel with an outline of the nucleus segmentation.
Result tables
The resulting measurements will be saved in .csv tables either collected or per individual image in case of the intensity profiles:
OutputFolder
├── <Date>-<Time>-settings.xml
├── cellMeasurements.csv
├── organelleDistance.csv
├── organelleDistanceFromMembrane.csv (Optional)
└── <imageName>
├── cellSegmentation.png
├── Detections.tiff
├── intDistance.csv
├── intensityDistanceFromMembrane.csv (Optional)
└── nucSegmentation.png
- .xml settings: will be created containing the processing settings used.
- cellMeasurements.csv: file contains the measurements of size, number of detections, mean intensities and center of mass of nucleus.
- organelleDistance.csv: contains the distance from the nucleus edge and peak intensity values for each detected organelle.
- organelleDistanceFromMembrane.csv (Optional): contains the distance from the cell edge as well as the peak intensity values for each detected organelle.
- intDistance.csv: file contains the measurements of the intensity values of each pixel in the cytoplasm segmentation and their distance from the nucleus.
- intensityDistanceFromMembrane.csv: file contains the measurements of the intensity values of each pixel in the cytoplasm segmentation and their distance from the cell edge.